In yesterday’s Advisor, we explored five dangers of big data; today, we present distribution dangers, stratification problems, and more.
 |
[Go here for dangers 1 to 5)
6. Distribution Dangers
There are two primary distribution dangers you’ll face: outliers and stratification.
Outliers
Here is the situation. You have surveyed 22 employers in your industry that are similar to your employer in size and sales, and you find that their average cost per hire (CPH) is $3,433. You are feeling pretty smug because your CPH is $2,800. But dig into the data.
Here are the CPH figures for the 22 companies surveyed:
|
$2,000 |
$2,600 |
|
$2,300 |
$2,400 |
|
$2,200 |
$2,300 |
|
$2,300 |
$2,500 |
|
$2,100 |
$2,300 |
|
$2,700 |
$1,900 |
|
$2,300 |
$2,150 |
|
$2,450 |
$2,300 |
|
$2,400 |
$2,200 |
|
$2,100 |
$14,700 |
|
$2,400 |
$15,800 |
In fact, 20 of the companies have CPHs well below your $2,800. However, two of the companies’ CPHs are much higher, one with $14,700 and one with $15,800. Those two outliers are skewing the data. Research reveals that in the company with $14,700, the only new hire reported was a new president. And the company with $15,800 had to hire from abroad and relocation expenses were included in their figures.

Eliminating the outliers, the average CPH for the remaining 20 companies was $2,300. And your CPH suddenly doesn’t look so good.
Compensation.BLR.com, now thoroughly revved with easier navigation and more complete compensation information, will tell you what’s being paid right in your state–or even metropolitan area–for hundreds of jobs. Try it at no cost and get a complimentary special report. Read More.
7. Stratification
Another type of danger comes from how you array your data. When collecting data from a large number of subjects, you typically stratify the data. For example, if looking at the number of employees, you typically divide the responses into groups, like 1 to 49 employees, 50 to 99 employees, 100 to 499 employees, etc.
Here’s an example of some weekly readings on some factor:
|
Info 1 |
3 |
|
Info 2 |
7 |
|
Info 3 |
22 |
|
Info 4 |
45 |
|
Info 5 |
81 |
|
Info 6 |
23 |
|
Info 7 |
23 |
|
Info 8 |
81 |
|
Info 9 |
45 |
|
Info 10 |
22 |
|
Info 11 |
7 |
|
Info 12 |
3 |
For ease of charting, you choose to band together the data points in groups of 2. So, Info 1 (3) and Info 2 (7) combine for an average of 5, and so on.
|
Info 1 to 2 |
5.0 |
|
Info 3 to 4 |
33.5 |
|
Info 5 to 6 |
52.0 |
|
Info 7 to 8 |
52.0 |
|
Info 9 to 10 |
33.5 |
|
Info 11 to 12 |
5.0 |
And here’s the chart that produces:
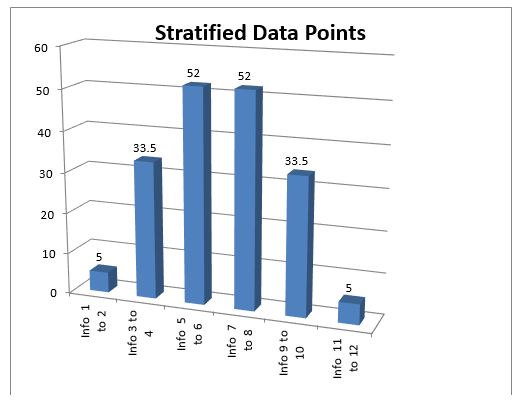
That’s an expected normal curve, so you assume normal distribution. But what if you instead chart all the original data points? Now, the chart looks like this.

Obviously, something is going on with this bipolar distribution. Again, the data are the same in both charts; it’s just the approach to charting that changes.
8. History
You’ve established a program to improve engagement, and your survey shows improvement. But is it due to the program? Has something else happened at the same time that might explain the improvement? For example, is there new leadership with a new outlook? Is there a sharp rise in sales and profits and a great bonus?
9. Interpretation
Similarly, data are subject to different interpretations. For example, say you have been tracking turnover, have installed programs to improve retention, and can show the board or the C-suite that you have improved retention by 22 percent year over year.
One board member says, I disagree with your conclusion; I think your retention is improving because you have hired such weak people that none of them could find a job anywhere else.
From dealing with big data to determining merit increases to designing affordable incentive plans for the coming year, compensation and benefits are never easy. “Maintain internal equity and external competitiveness, with benefits and compensation, and control turnover, but still meet management’s demands for lowered costs.” Sound familiar?
Many of the professionals we serve find helpful answers to all their compensation and benefits questions at Compensation.BLR.com®, BLR’s comprehensive compensation website.
And there’s great news! The site has just been revamped in two important ways. First, compliance focus information has been updated to include the latest on the Consolidated Omnibus Budget Reconciliation Act (COBRA), Lilly Ledbetter, and the Family and Medical Leave Act (FMLA). Second, user features are enhanced to make the site even quicker to respond to your particular needs, such as:
- Topics Navigator—Lets you drill down by topical areas to get to the right data quickly
- Customizable Home Page—Can be configured to display whatever content you want to see most often
- Menu Navigation—Displays all the main content areas and tools that you need in a simple, easy format
- Quick Links—Enables you to quickly navigate to all the new and updated content areas
The services provided by this unique tool include:
- Localized salary finder. Based on reliable research among thousands of employers, there are pay scales (including 25th, 50th, 75th, and 90th percentiles) for hundreds of commonly held jobs, from line worker to president of the company. The data are customized for your state and metro area, your industry, and your company size, so you can base your salaries on what’s offered in your specific market, not nationally.
Try BLR’s all-in-one compensation website, Compensation.BLR.com®, and get a complimentary special report, Top 100 FLSA Overtime Q&As, no matter what you decide. Find out more.
- State and federal wage-hour and other legal advice. Plain-English explanations of wage-hour and other compensation- and benefits-related laws at both federal and state levels. “State” means the laws of your state because the site is customized to your use. (Other states can be added at a modest extra charge.)
- Job descriptions. The website provides them by the hundreds, already written, legally reviewed, and compliant with the Americans with Disabilities Act (ADA) mandate that essential job functions be separated from those less critical. All descriptions carry employment grade levels to current norms—another huge time-saver.
- Merit increase, salary, and benefits surveys. The service includes the results of three surveys per year. Results for exempt and nonexempt employees are reported separately.
- Daily updates. Comp and benefits news updated daily (as is the whole site).
- “Ask the Experts” service. E-mail a question to our editors and get a personalized response within 3 business days.
If we sound as if we’re excited about the program, it’s because we are. For about $3 a working day, the help it offers to those with compensation responsibilities is enormous.
This one’s definitely worth a look, which you can get by clicking the link below.
Click here to get more information or start a no-cost trial and get a complimentary special report!