When in doubt about how to set an accurate salary range for a given position, market survey data are crucial. That’s Compensation 101-level stuff. What’s not always so clear, however, is what to do with those data.
 |
You could, hypothetically, use the 10th, 50th, and 90th percentiles as your minimum, midpoint, and maximum for the range. But maybe the 25th, 50th, and 75th percentiles would be better? A problem with either of those options is that those points tend to fluctuate with the survey data—so your range spread varies from position to position.
Read on for tips from BLR’s Senior Compensation Editor Sharon McKnight, CCP, SPHR, on how to work around this problem.
Look to the Midpoint
You can calculate a consistent range spread based on the midpoint of the salary data. You just have to decide which midpoint to use—the mean or the 50th percentile.
Either way, there is a simple method for determining the min, mid, and max of a salary range when only the midpoint of the survey data is known.
Compensation scorecards can help EVERY organization. Start on Wednesday, June 17, 2015, with a new interactive webinar, Winning Compensation Scorecards: What and How to Measure for Effective Results. Learn More
Pick a Number
The first decision you need to make is the range spread. Do you want it to be 25%, 50%, 75%, or even more? It’s important to be consistent in how the range spread is calculated across job types. For example, nonexempt jobs could have a range spread of 25% or 30% and exempt jobs could have a range spread of 40% or 50%. Here’s a sample of one way to designate range spread for all jobs within an organization:
- Manufacturing or service jobs—20% to 30%
- Clerical or technical jobs—30% to 40%
- Supervisory or professional jobs—40% to 50%
- Management or executive jobs—50% or more
The key is to pick one range spread rate for each job type in your organization, document it, and be consistent in how it is applied when setting the salary range for each of the jobs in a given job type.
Do the Math
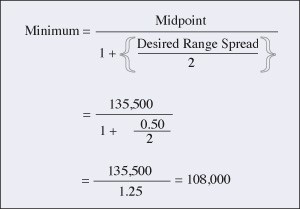
Let’s use 50% as our range spread. In this case, the midpoint of our range is $135,500. To find the minimum, divide the market rate by 1.00 + ½ of the range spread.
To find the maximum, multiply the minimum times 1 plus the range spread.
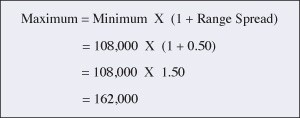
This creates a salary range that has a minimum of $108,000, a midpoint of $135,500, and a maximum of $162,000.
This simple formula can be used to establish a salary range for any job based on the midpoint of available salary market data.
When you do the math, it’s plain to see that applying logic in your compensation strategy quite literally pays off. There are also other highly effective tools, such as compensation scorecards, that can help take the guesswork out of compensation. What are these scorecards, and how should they be used? Fortunately, there’s timely help in the form of BLR’s new webinar—Winning Compensation Scorecards: What and How to Measure for Effective Results. In just 90 minutes, on Wednesday, June 17, you’ll learn everything you need to know about compensation scorecards and how they can improve transparency, hold managers accountable, and align merit increases and incentives with your overall compensation strategy.
Register today for this interactive webinar.
Are you applying accountability and logic to back up your compensation decisions? Join us Wednesday, June 17, 2015, for a new interactive webinar, Winning Compensation Scorecards: What and How to Measure for Effective Results. Earn 1.5 hours in HRCI Recertification Credit. Register Now
By participating in this interactive webinar, you’ll learn:
- Why a compensation scorecard is so important for every organization, regardless of its size
- The three essential steps in creating a winning compensation scorecard
- How to incorporate base pay and incentive actions into your scorecard for the most meaningful results
- How to connect the scorecard to other factors such as performance management, promotions, turnover, and hiring to provide rich context
- How to introduce a scorecard to get buy-in and establish accountability
- Case studies about what to avoid when introducing a compensation scorecard
- And much more!
Register now for this event risk-free.
Wednesday, June 17, 2015
1:30 p.m. to 3:00 p.m. (Eastern)
12:30 p.m. to 2:00 p.m. (Central)
11:30 a.m. to 1:00 p.m. (Mountain)
10:30 a.m. to 12:00 p.m. (Pacific)
Approved for Recertification Credit
This program has been approved for 1.5 credit hours toward recertification through the Human Resource Certification Institute (HRCI).
Join us on Wednesday, June 17, 2015—you’ll get the in-depth Winning Compensation Scorecards: What and How to Measure for Effective Results webinar AND you’ll get all of your particular questions answered by our experts.
Train Your Entire Staff
As with all BLR/HRhero webinars:
- Train all the staff you can fit around a conference phone.
- Get your (and their) specific phoned-in or emailed questions answered in Q&A sessions that follow the presentation.
Any tips of evaluating market data? It’s not all useful or credible.